Events
import { Aside } from ‘@astrojs/starlight/components’;
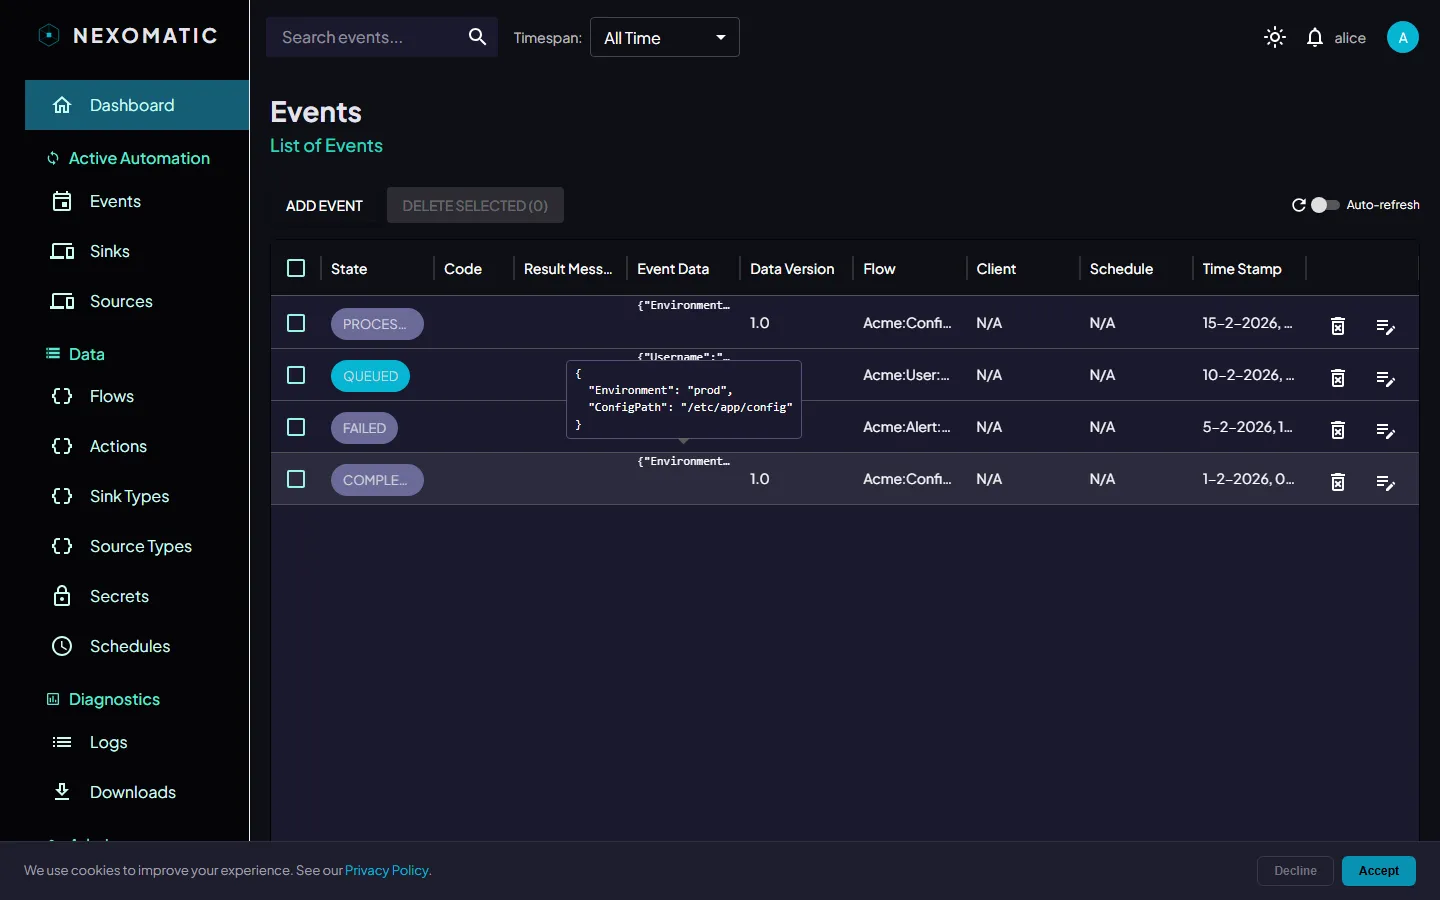
The Events screen shows every event in your tenant — queued, running, and completed. It is the primary place to monitor your automation pipeline and diagnose failures.
The Events Table
Section titled “The Events Table”Events are displayed in a server-side paginated table. The most recent events appear first.
Columns
Section titled “Columns”| Column | Description |
|---|---|
| State | Colour-coded chip: SUCCESS (green), ERROR (red), WARNING / RUNNING (orange), QUEUED (grey) |
| Result Code | Numeric exit code returned by the task module |
| Result Message | Summary message. Hover to see all messages in a tooltip |
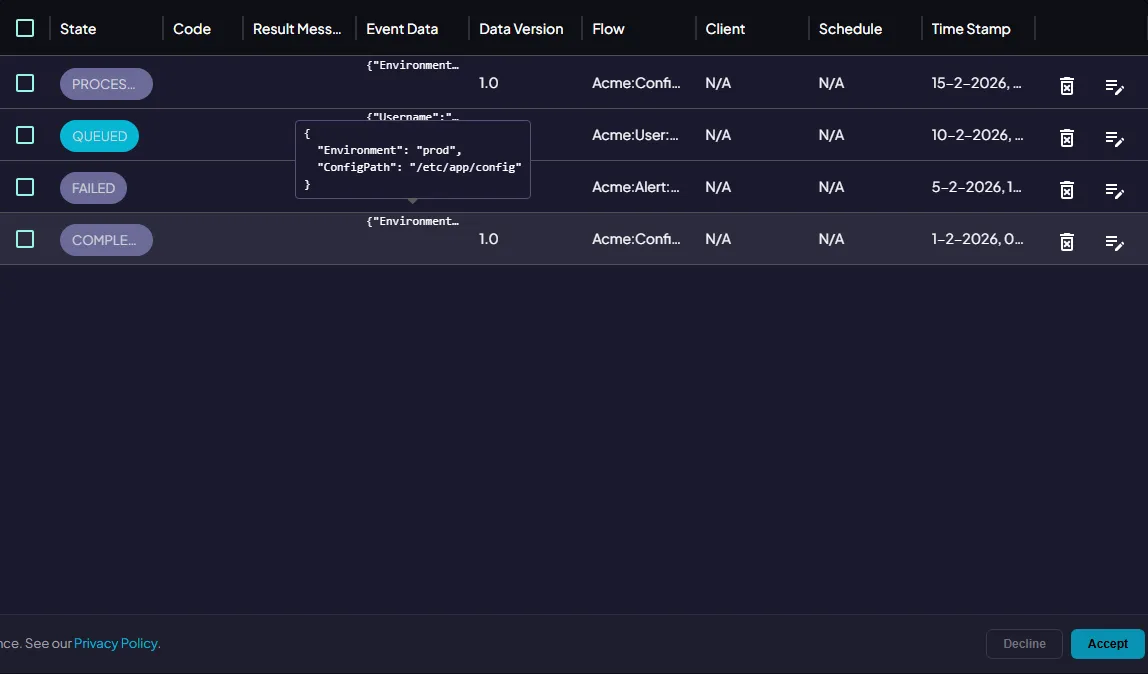
| Event Data | JSON payload passed to the task. Hover for the full document |
| Data Version | Incremented each time the event data is updated |
| Event Type | The Event Type that this event belongs to |
| Sink | The sink agent that executed (or is executing) this event |
| Schedule | The schedule that triggered this event (if applicable) |
| Timestamp | When the event was created |
State chips
Section titled “State chips”
Each event row shows a state chip. Click the chip to open the event detail panel.
Search & Filtering
Section titled “Search & Filtering”
Search
Section titled “Search”Type in the Search events… field on the left of the topbar. Results filter instantly on the server — matches on event type name, state, result message, and other fields.

Date / Time Filter
Section titled “Date / Time Filter”Select a time range from the Timespan dropdown in the topbar to restrict events to a specific window.

| Preset | Range |
|---|---|
| Last 5 min | Now − 5 minutes |
| Last 30 min | Now − 30 minutes |
| Last 1 hour | Now − 1 hour |
| Today | Start of today |
| Last 24 hours | Now − 24 hours |
| Last week | Now − 7 days |
| Custom range | Pick any start and end date/time |
Click Clear to remove the filter and show all events.
Auto-Refresh
Section titled “Auto-Refresh”Use the Auto-refresh control in the toolbar to automatically reload the list on a fixed interval. This is useful when monitoring a running pipeline.
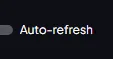
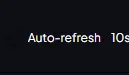
Toggle the switch to enable auto-refresh, then choose an interval:
| Interval | Reload frequency |
|---|---|
| 10s | Every 10 seconds |
| 30s | Every 30 seconds (default) |
| 1m | Every minute |
| 5m | Every 5 minutes |
Click the refresh icon (↺) at any time to trigger an immediate reload regardless of the auto-refresh state.
Row Actions
Section titled “Row Actions”Each row has action buttons on the right:
| Button | Action |
|---|---|
| Edit icon | Opens the event detail panel |
| Delete icon | Deletes the event after confirmation |
| Log icon | Opens the raw log viewer (only shown when a log file is available) |
Clicking the State chip also opens the detail panel.
Bulk Delete
Section titled “Bulk Delete”Check the checkboxes on the left of multiple rows, then click Delete Selected (N) in the toolbar above the table to delete all selected events at once.
Event Detail Panel
Section titled “Event Detail Panel”Click an event’s state chip or edit button to open the detail panel.
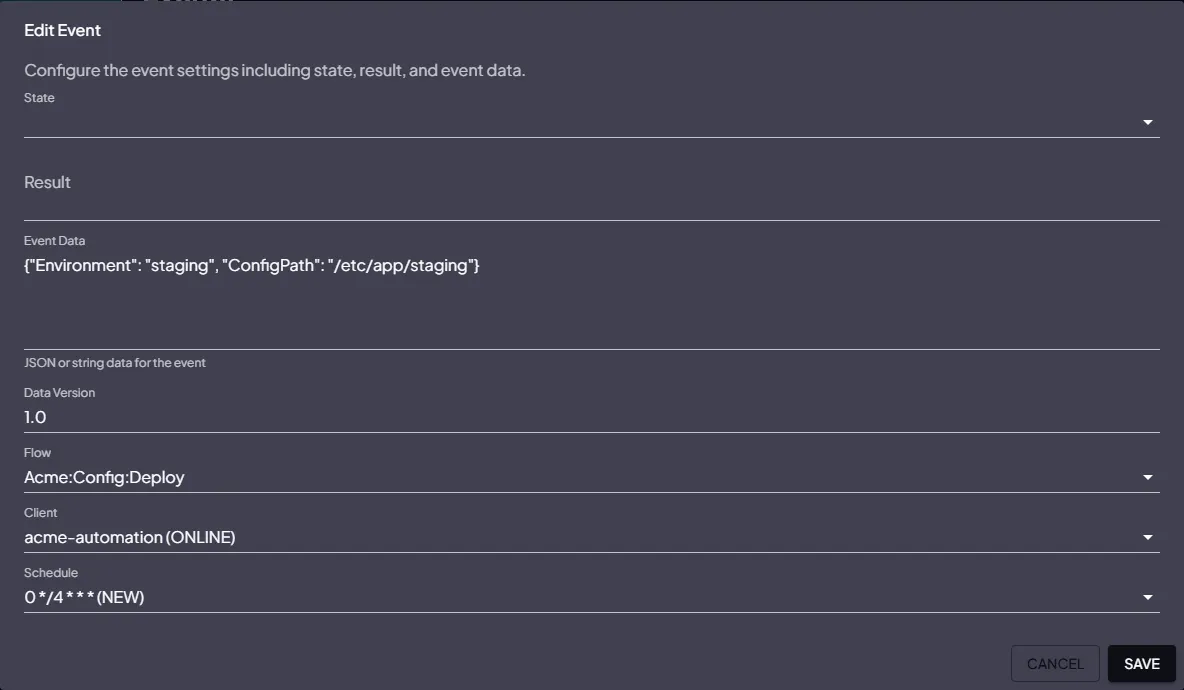
The panel shows:
- Full event payload (formatted JSON)
- All result messages
- Result data output
- Execution timestamps
- Parent event (if this event was triggered by a chain)
Log Viewer
Section titled “Log Viewer”When a task produces a log file, the log icon appears in the row’s actions column. Clicking it opens a modal that fetches and displays the raw log output from the sink — useful for debugging failed tasks.
The log viewer renders the content in a monospace scrollable box. Close it with the × button or by pressing Escape.