
Dashboard
import { Aside } from ‘@astrojs/starlight/components’;
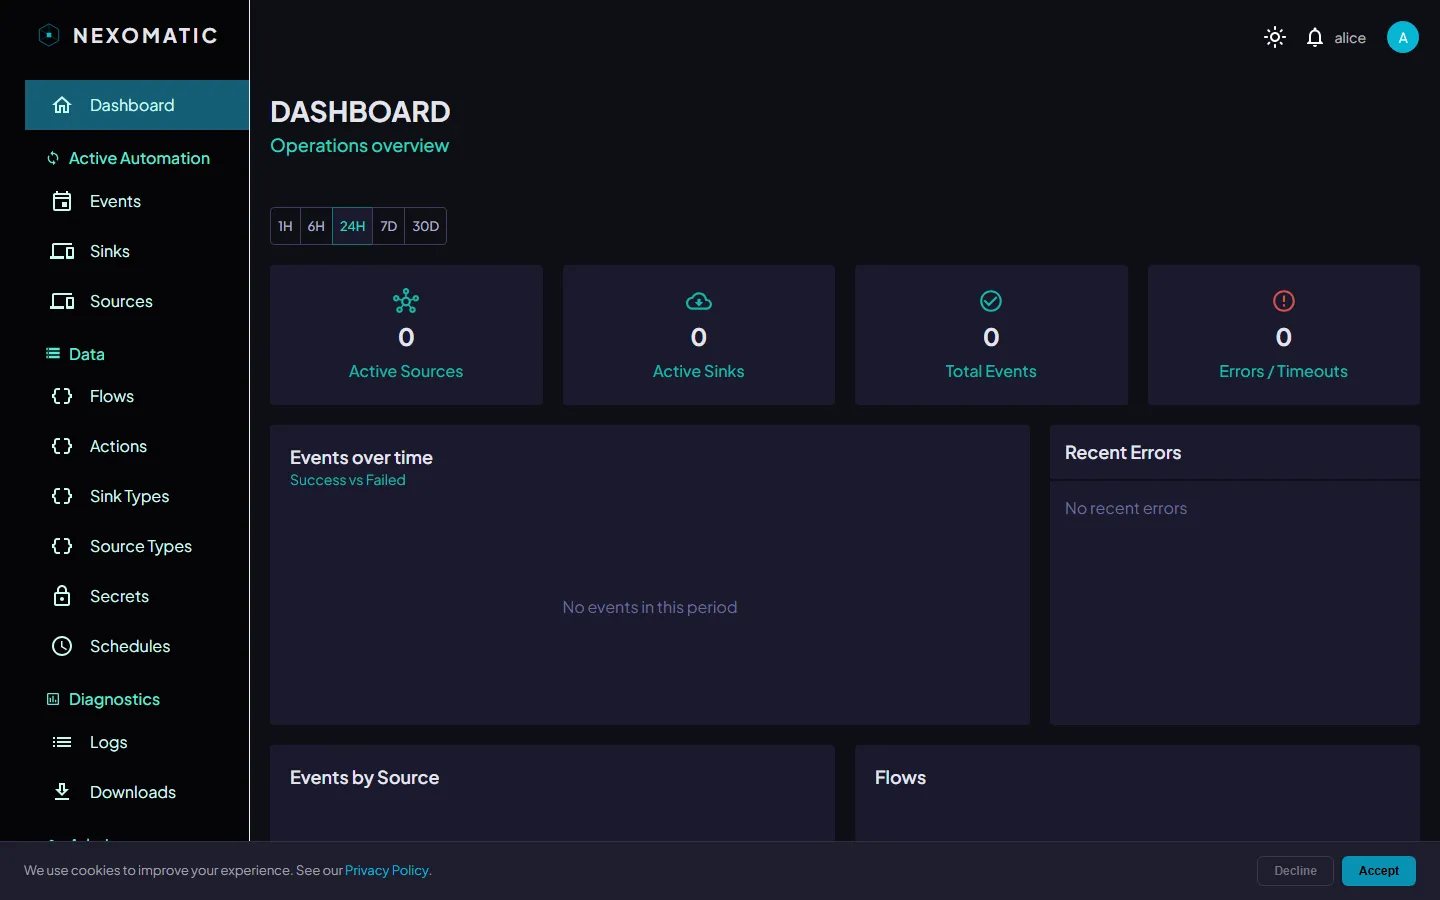
The Dashboard is the first screen after login. It provides a real-time overview of event activity and connected sinks across your tenant.
Layout
Section titled “Layout”The dashboard is divided into three sections: stat cards, charts, and a pie chart.
Stat Cards
Section titled “Stat Cards”Four summary cards display the current state of your platform for the selected time window.

| Card | What it shows |
|---|---|
| Total Events | Number of events in the selected time window |
| Errors | Count of events in ERROR state |
| Connected Sinks | Number of sink agents currently ONLINE |
| Source Types | Number of distinct source types that have fired events |
Charts
Section titled “Charts”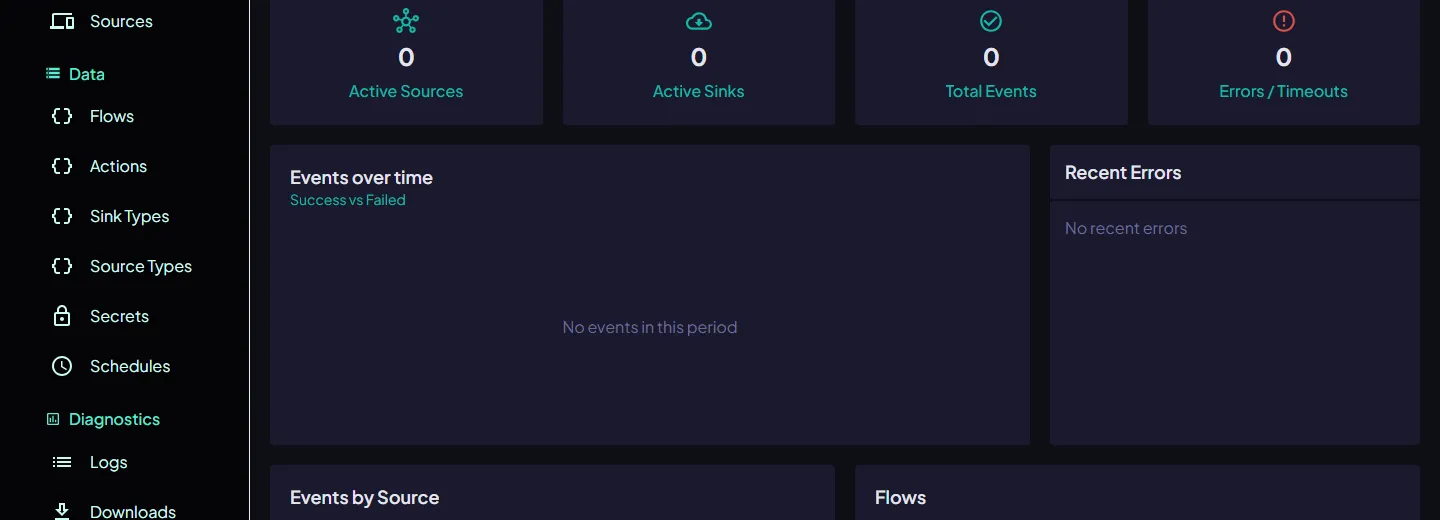
- Line chart — Events over time, broken down by state (
SUCCESS,ERROR,WARNING,QUEUED). - Bar chart — Event volume per time bucket, coloured by state. Useful for spotting bursts or gaps.
- Pie chart — Event state distribution as a proportion of total events. A healthy system shows mostly
SUCCESS.
Time Window
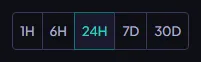
Section titled “Time Window”Use the toggle buttons to change the time window for all charts and stat cards.
| Button | Window |
|---|---|
| 1h | Last 1 hour |
| 6h | Last 6 hours |
| 24h | Last 24 hours |
| 7d | Last 7 days |
| 30d | Last 30 days |
Navigation
Section titled “Navigation”Sidebar
Section titled “Sidebar”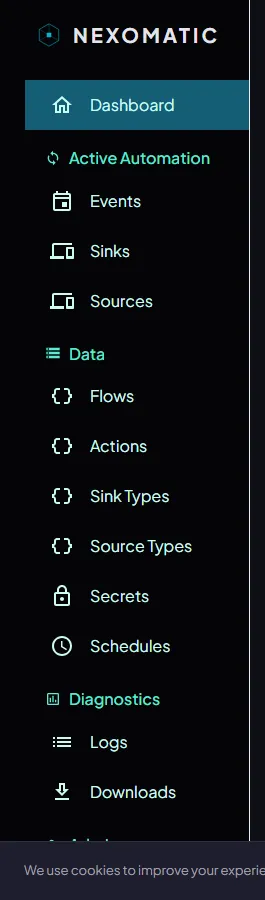
Use the sidebar on the left to navigate to any section. The sidebar can be collapsed to icon-only mode by clicking the toggle at the top — hover over an icon to see a flyout label.
| Section | Contents |
|---|---|
| Dashboard | This screen |
| Events | Live event queue and history |
| Sinks | Registered sink agents |
| Sources | Registered source agents |
| Flows | Flow definitions |
| Sink Types | Sink Type definitions |
| Source Types | Source Type definitions |
| Actions | Reusable action definitions |
| Schedules | Cron schedules |
| Logs | Task execution logs |
| Secrets | Tenant secret store |
| Users | User management (Admin only) |
| Settings | Account and tenant settings (Admin only) |
Topbar
Section titled “Topbar”
The topbar appears on every screen and contains:
- Search bar — available on list screens; filters the current list in real time
- Date/time filter — on Events and Logs; select a preset or custom range
- Theme toggle — switch between dark and light mode
- Account menu — click your name or tenant chip (top-right) for profile, settings, and logout
- Account menu — click your name (top-right) to access your profile, settings, and logout
Auto-Refresh
Section titled “Auto-Refresh”The dashboard does not auto-refresh automatically. Use the browser refresh button or navigate away and back. For live monitoring, the Events and Logs screens support auto-refresh.