
Traces
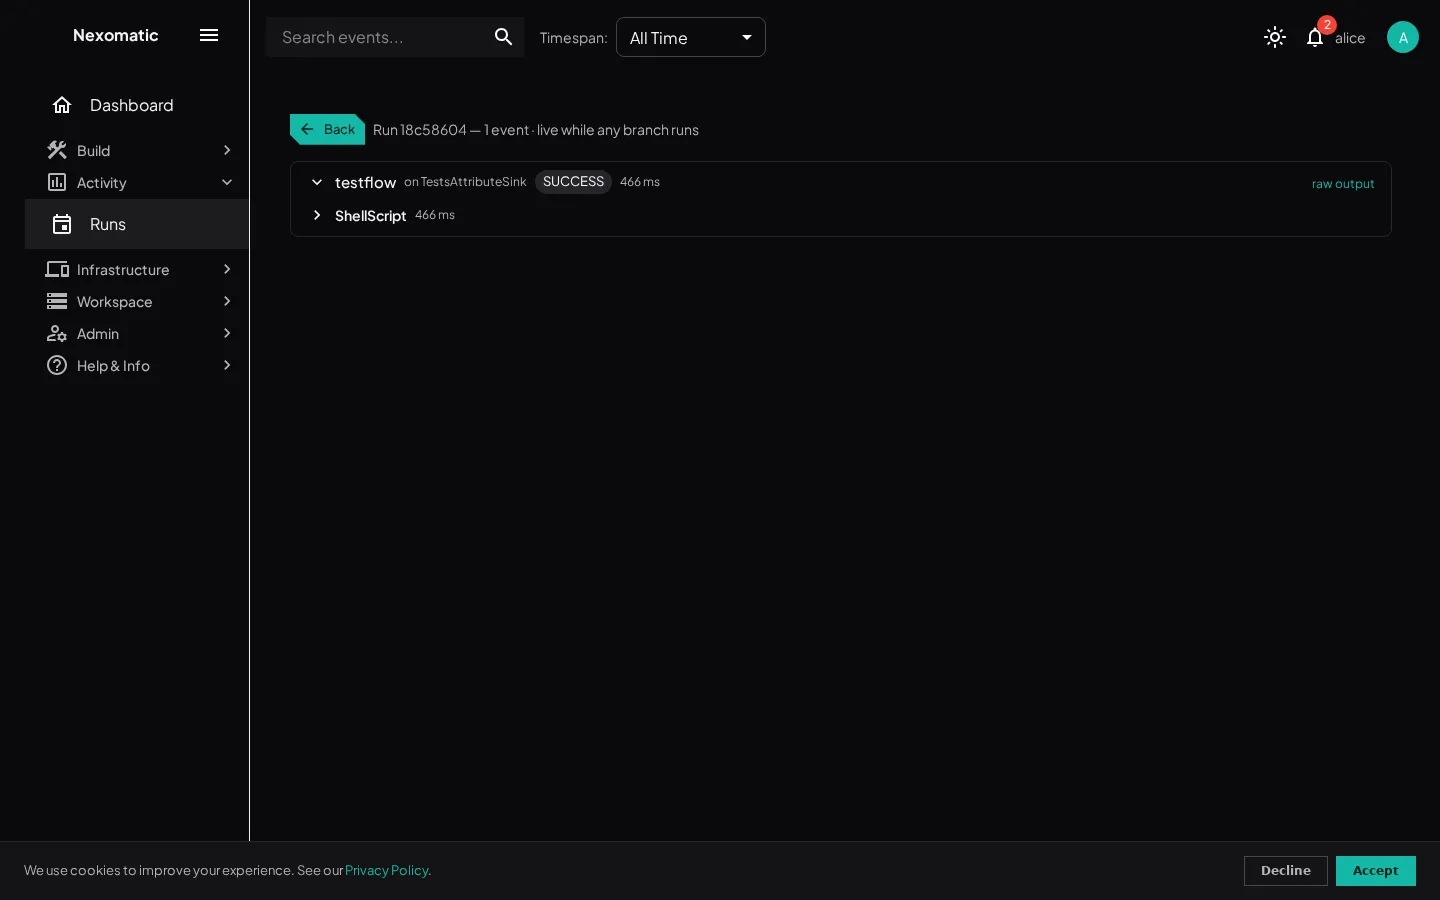
The trace is the run’s detail: click a run on the Runs screen and its trace flies in over the list — the whole waterfall, each event branch of the run (with its flow, status, duration, the sink that ran it, and the script-declared outcome), the module spans the sink executed, the steps a script declared, and every line inside them, with durations and statuses. The waterfall grows live while the run executes; when a run predates live traces, the detail falls back to its log records. A back row returns to the list.
The trace waterfall
Section titled “The trace waterfall”- Branches — one header per event of the run (a trigger’s fan-out chain), with its flow, status, duration, outcome label, the branch’s progress (the script’s latest
progressmarker, updating live while the run executes), and a raw output link that opens the full task output in a new tab (a plain link to the presigned log URL — no fetch, so it works on every storage backend). - Module spans — the runner wraps every module execution automatically, so runs without script markers still get a waterfall.
- Steps — scripts narrate their own work with step markers (see Actions & Libraries); a step’s start reads
▶(accent) and its finish■with the step’s duration and result — a failed finish renders red. - Lines — expand a node to read its lines; structured
logmarkers render in their level’s color (italic), and raw output lines show the script’s message without the runner’s own log header.
The log search (secondary mode)
Section titled “The log search (secondary mode)”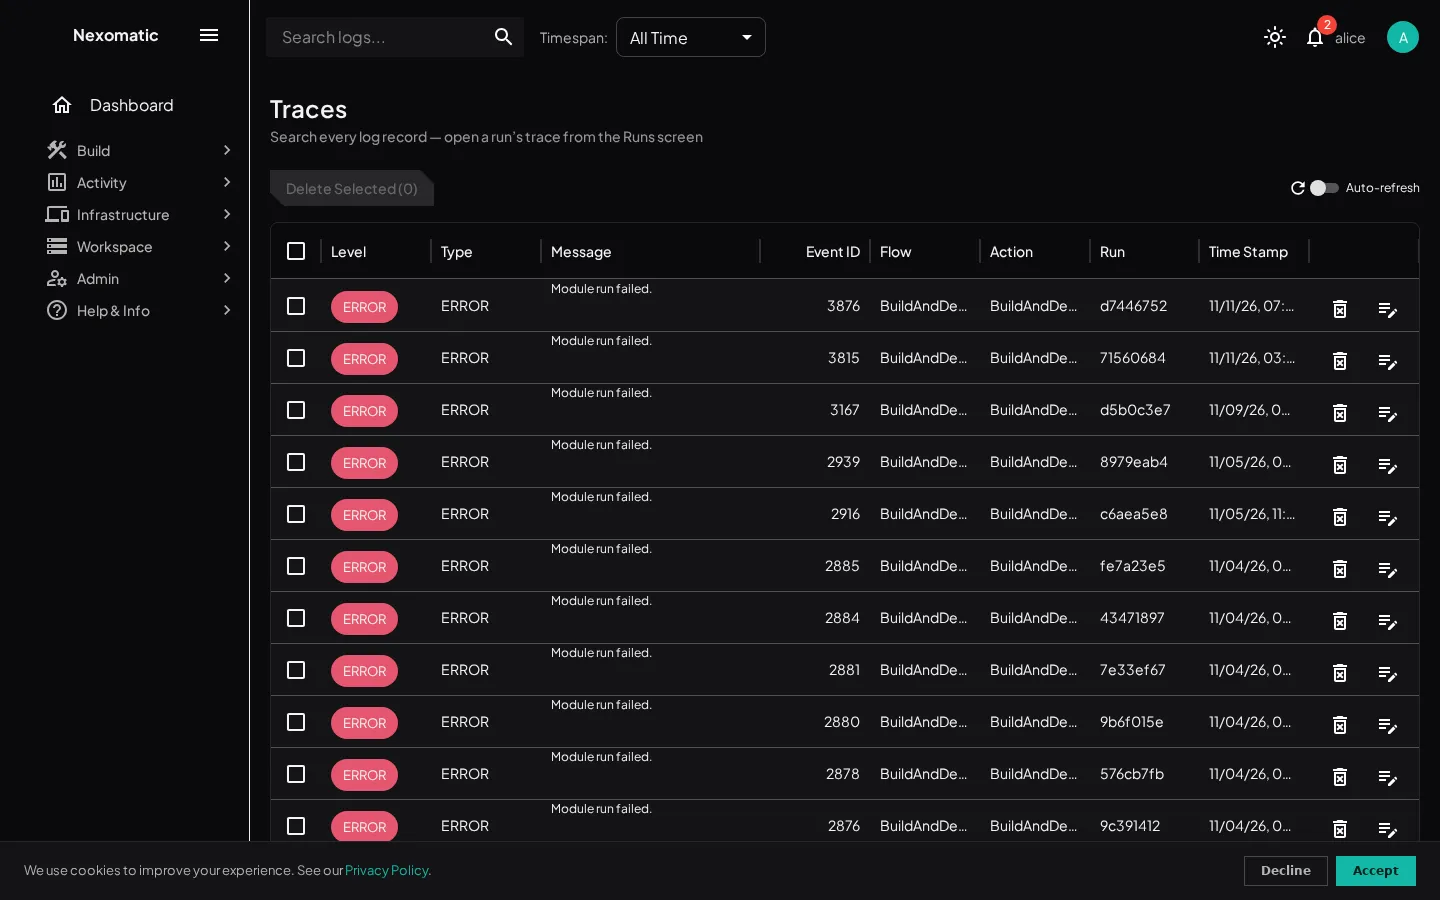
The global log search is the flat table of every structured log record, searchable and filterable across runs — reachable via search all records on the Runs screen header. Clicking a record row opens that record’s run trace (with a back row to the search).
Records older than your plan’s retention are still shown here — they are read from the long-term archive. See Data Retention for how retention works on your plan.
The search table
Section titled “The search table”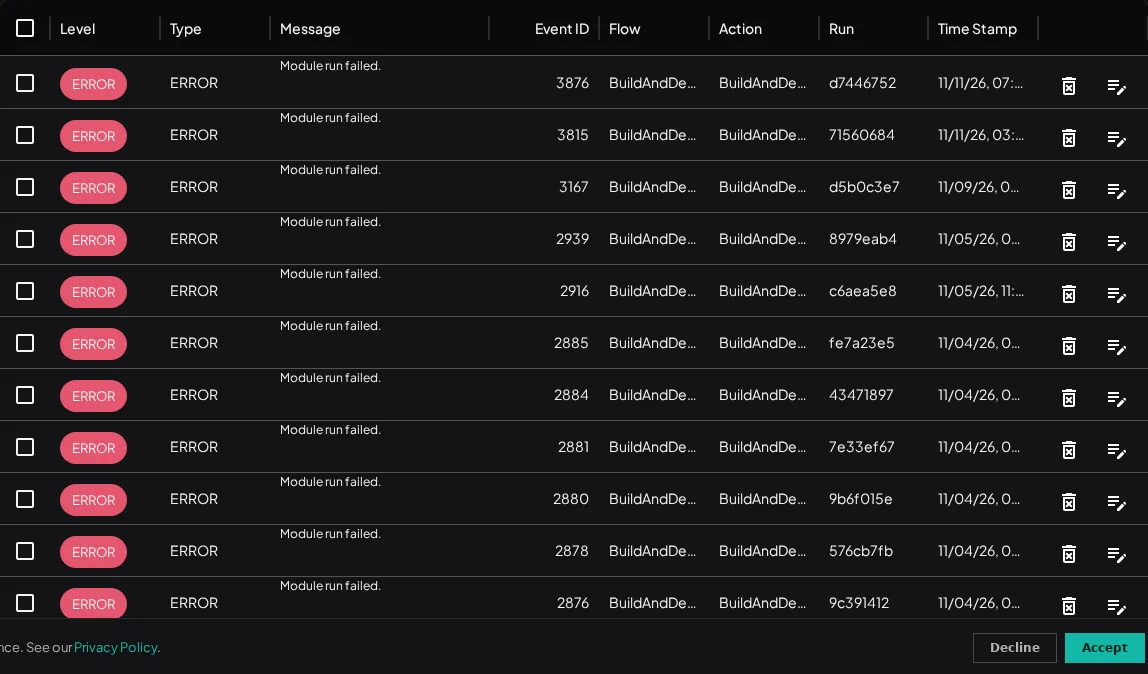
Columns
Section titled “Columns”| Column | Description |
|---|---|
| ID | The record’s internal id |
| Level | Log severity: DEBUG, INFO, WARNING, ERROR, CRITICAL |
| Type | The record’s type — structured log markers fan out here (steps, status, and progress live in the trace itself, not the table) |
| Message | The log message text |
| Event ID | The event this log belongs to |
| Flow | The flow the event ran in |
| Action | The action that produced this log |
| Run | Short run id — all fan-out branches of one trigger run share it |
| Time Stamp | When the log entry was written |
Search & Filtering
Section titled “Search & Filtering”
Search
Section titled “Search”Type in the Search logs… field in the topbar to filter by message text, level, type, flow, or action. Results update on the server as you type.
Date / Time Filter
Section titled “Date / Time Filter”The Timespan dropdown lets you restrict logs to a time window.
| Preset | Range |
|---|---|
| Last 5 min | Now − 5 minutes |
| Last 30 min | Now − 30 minutes |
| Last 1 hour | Now − 1 hour |
| Today | Start of today |
| Last 24 hours | Now − 24 hours |
| Last week | Now − 7 days |
| Custom range | Pick any start and end date/time |
Click Clear to remove the filter.
Auto-Refresh
Section titled “Auto-Refresh”Use the Auto-refresh control to reload the log table automatically.
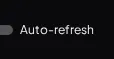
Toggle the switch to enable, then choose an interval (10 s, 30 s, 1 m, or 5 m). Click the ↺ icon to trigger an immediate reload at any time.
Row Actions
Section titled “Row Actions”| Button | Action |
|---|---|
| Edit icon | Opens the log entry detail panel showing the full message and metadata |
| Delete icon | Deletes the log record after confirmation |
Bulk Delete
Section titled “Bulk Delete”Select multiple rows using the checkboxes, then click Delete Selected (N) to remove them.
Log Levels
Section titled “Log Levels”| Level | Meaning |
|---|---|
DEBUG | Verbose diagnostic output — usually only useful when troubleshooting |
INFO | Normal operation milestones |
WARNING | Something unexpected happened but the task completed |
ERROR | The task encountered a failure |
CRITICAL (50) | A critical failure requiring immediate attention |