
Runs
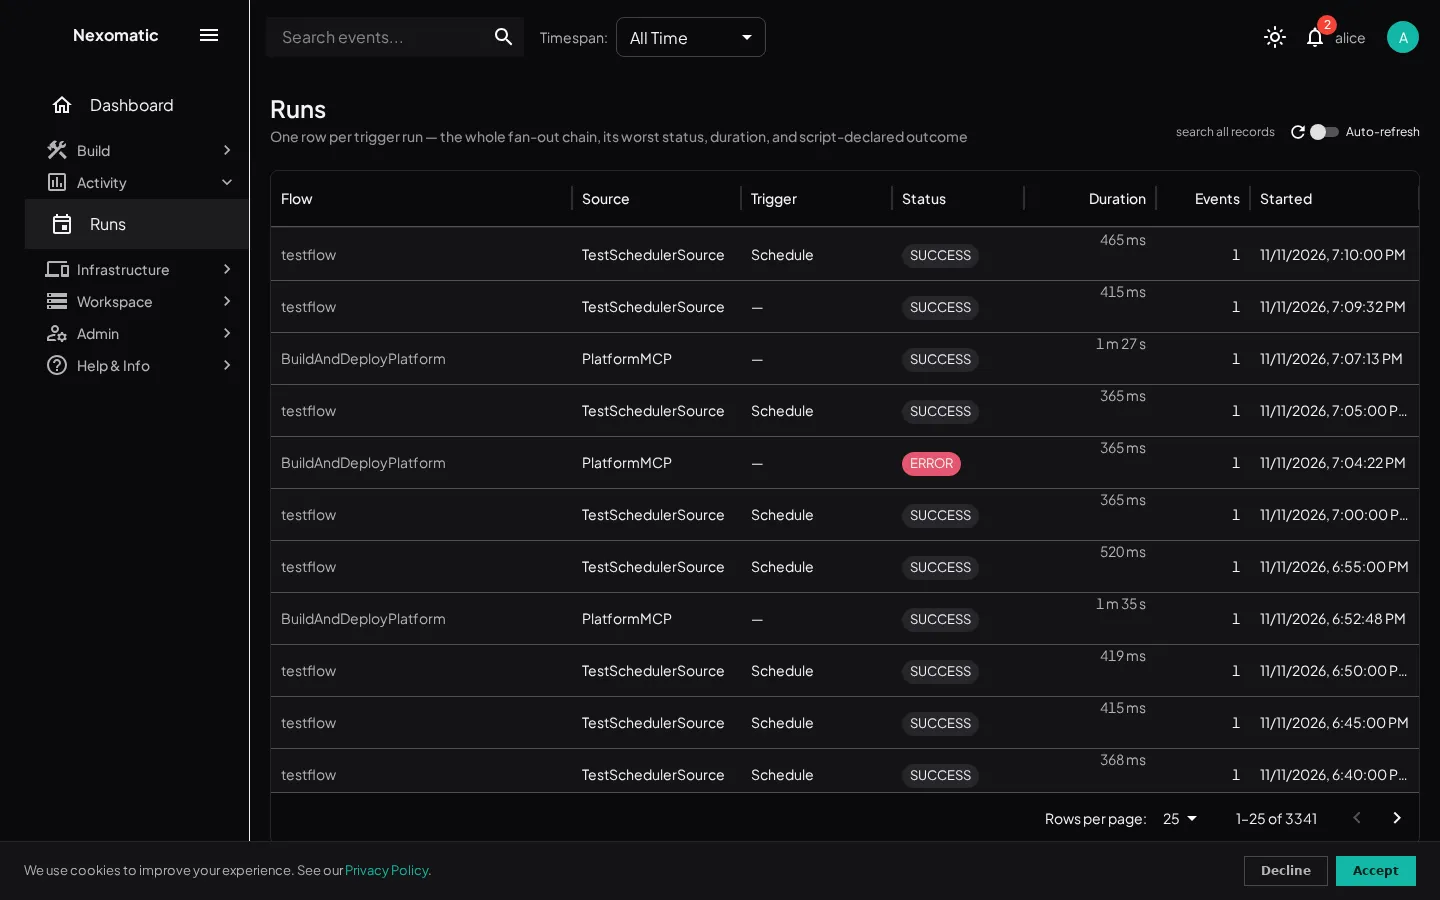
The Runs screen (sidebar → Activity → Runs) is the run-centric view of your automations: one row per run — the root event of a trigger and every chained event it fans out into, collapsed into a single row. Click a run to open its trace, which flies in over the list with a back row.
Columns
Section titled “Columns”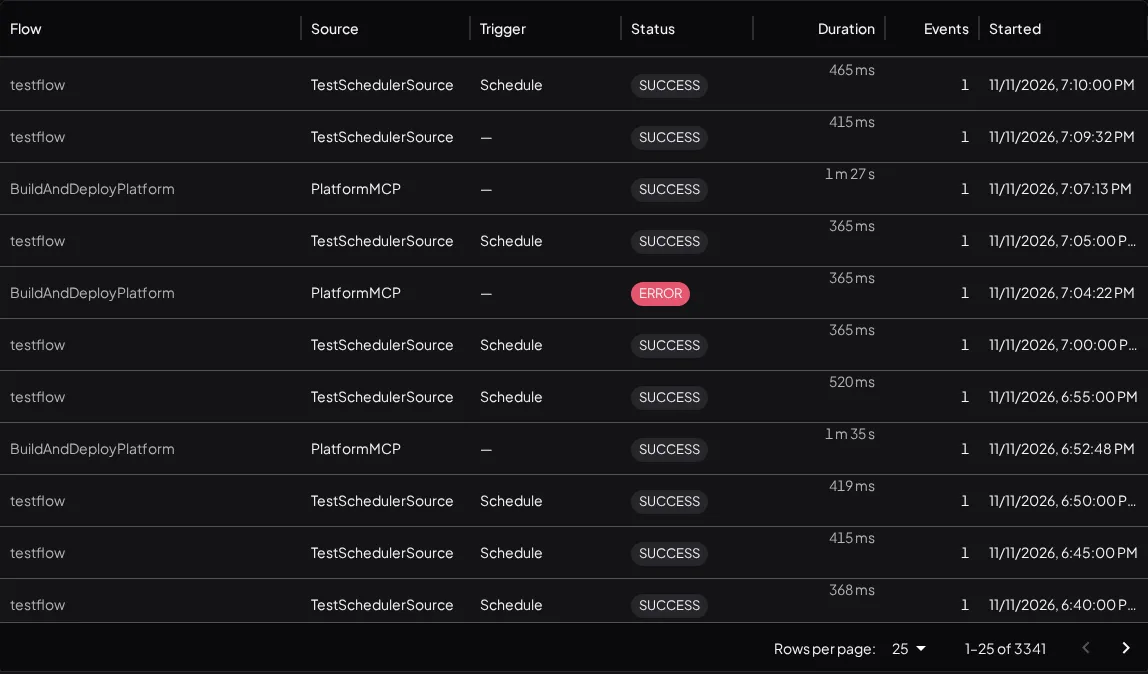
| Column | Description |
|---|---|
| Flow | The flow the run executed |
| Source | The source that fired the run — the flow’s schedule source for cron fires, its MCP source for agent tool calls, Manual for grid run-now, or the flow’s first source for older runs |
| Trigger | How the flow fired — Schedule, Webhook, File watch, MQTT — with the specific trigger’s identity next to it (Schedule · 0 9 * * *, File watch · /data/in), Manual for runs fired by the flows grid’s run-now action, or — when the run wasn’t flow-triggered |
| Status | The worst status across the run’s events — RUNNING while any branch runs, then the worst terminal state (TIMED_OUT > ERROR > WARNING > SUCCESS); superseded events don’t count |
| Duration | The sum of the run’s tasks’ execution times (— for runs that predate duration tracking) |
| Events | How many events the run’s fan-out chain produced |
| Started | When the run’s first event was created |
The run trace
Section titled “The run trace”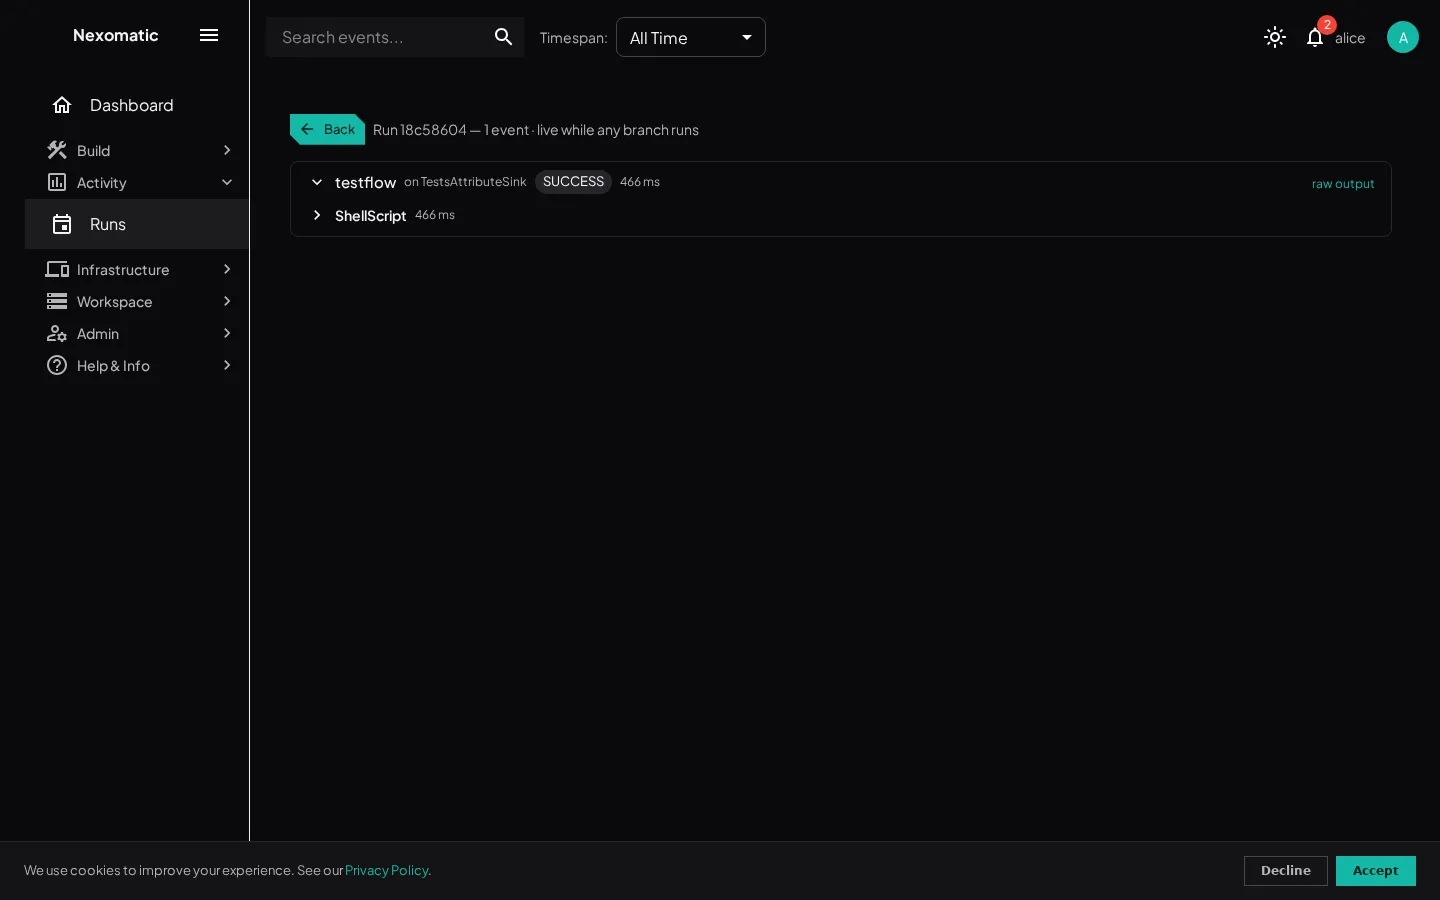
Clicking a run opens its trace as a fly-in detail:
- Branches — one expandable row per event of the run, with the flow, status, duration, the sink that ran it, the script-declared outcome (code and label, when the script set one), the branch’s progress (the script’s latest
progressmarker, updating live), and a raw output link that opens the full task output in a new tab. - Module spans — the runner wraps every module execution automatically, so runs without script markers still get a waterfall.
- Steps — scripts narrate their own work with step markers (see Actions & Libraries); a step’s start reads
▶and its finish■with the step’s duration and result. - Lines — expand a node to read its lines; structured
logmarkers render in their level’s color (italic), and raw output lines show the script’s message without the runner’s own log header.
The waterfall grows live while the run executes; the back row returns to the list.
Search all records
Section titled “Search all records”The search all records link in the header opens the global log search — the flat table of every structured log record across runs. Clicking a record opens that record’s run trace.